The Austrian Supply Chain Index
The COVID-19 pandemic, existing geopolitical conflicts and trade wars have exposed the vulnerability of supply chains to global and regional shocks. ASCII researchers have developed the Austrian Supply Chain Index (ASCPI) to better quantify and analyze supply bottlenecks that affect the Austrian economy.
Methodologically, the ASCPI is based on the GSCPI (Global Supply Chain Index) of the Federal Reserve New York, with the difference that the ASCPI focuses on supply-side bottlenecks that are relevant for Austrian companies.
To this end, it combines information from 10 different indicators (5 indicators from Austrian company surveys, 5 global transportation cost indicators) in order to present shortages affecting Austria in just one indicator. The result is a summary overview of the stress level that companies in this country currently face. The index is updated monthly.
Data gaps are closed based on the Kalman filter (modeling as a state space model) with the help of additional auxiliary variables. This allows the ASCPI to be displayed back to 2006. Furthermore, the indicators are adjusted for demand (new orders). The purpose of this is to eliminate the economic component in the variables so that the indicators primarily represent supply chain pressure on the supply side.
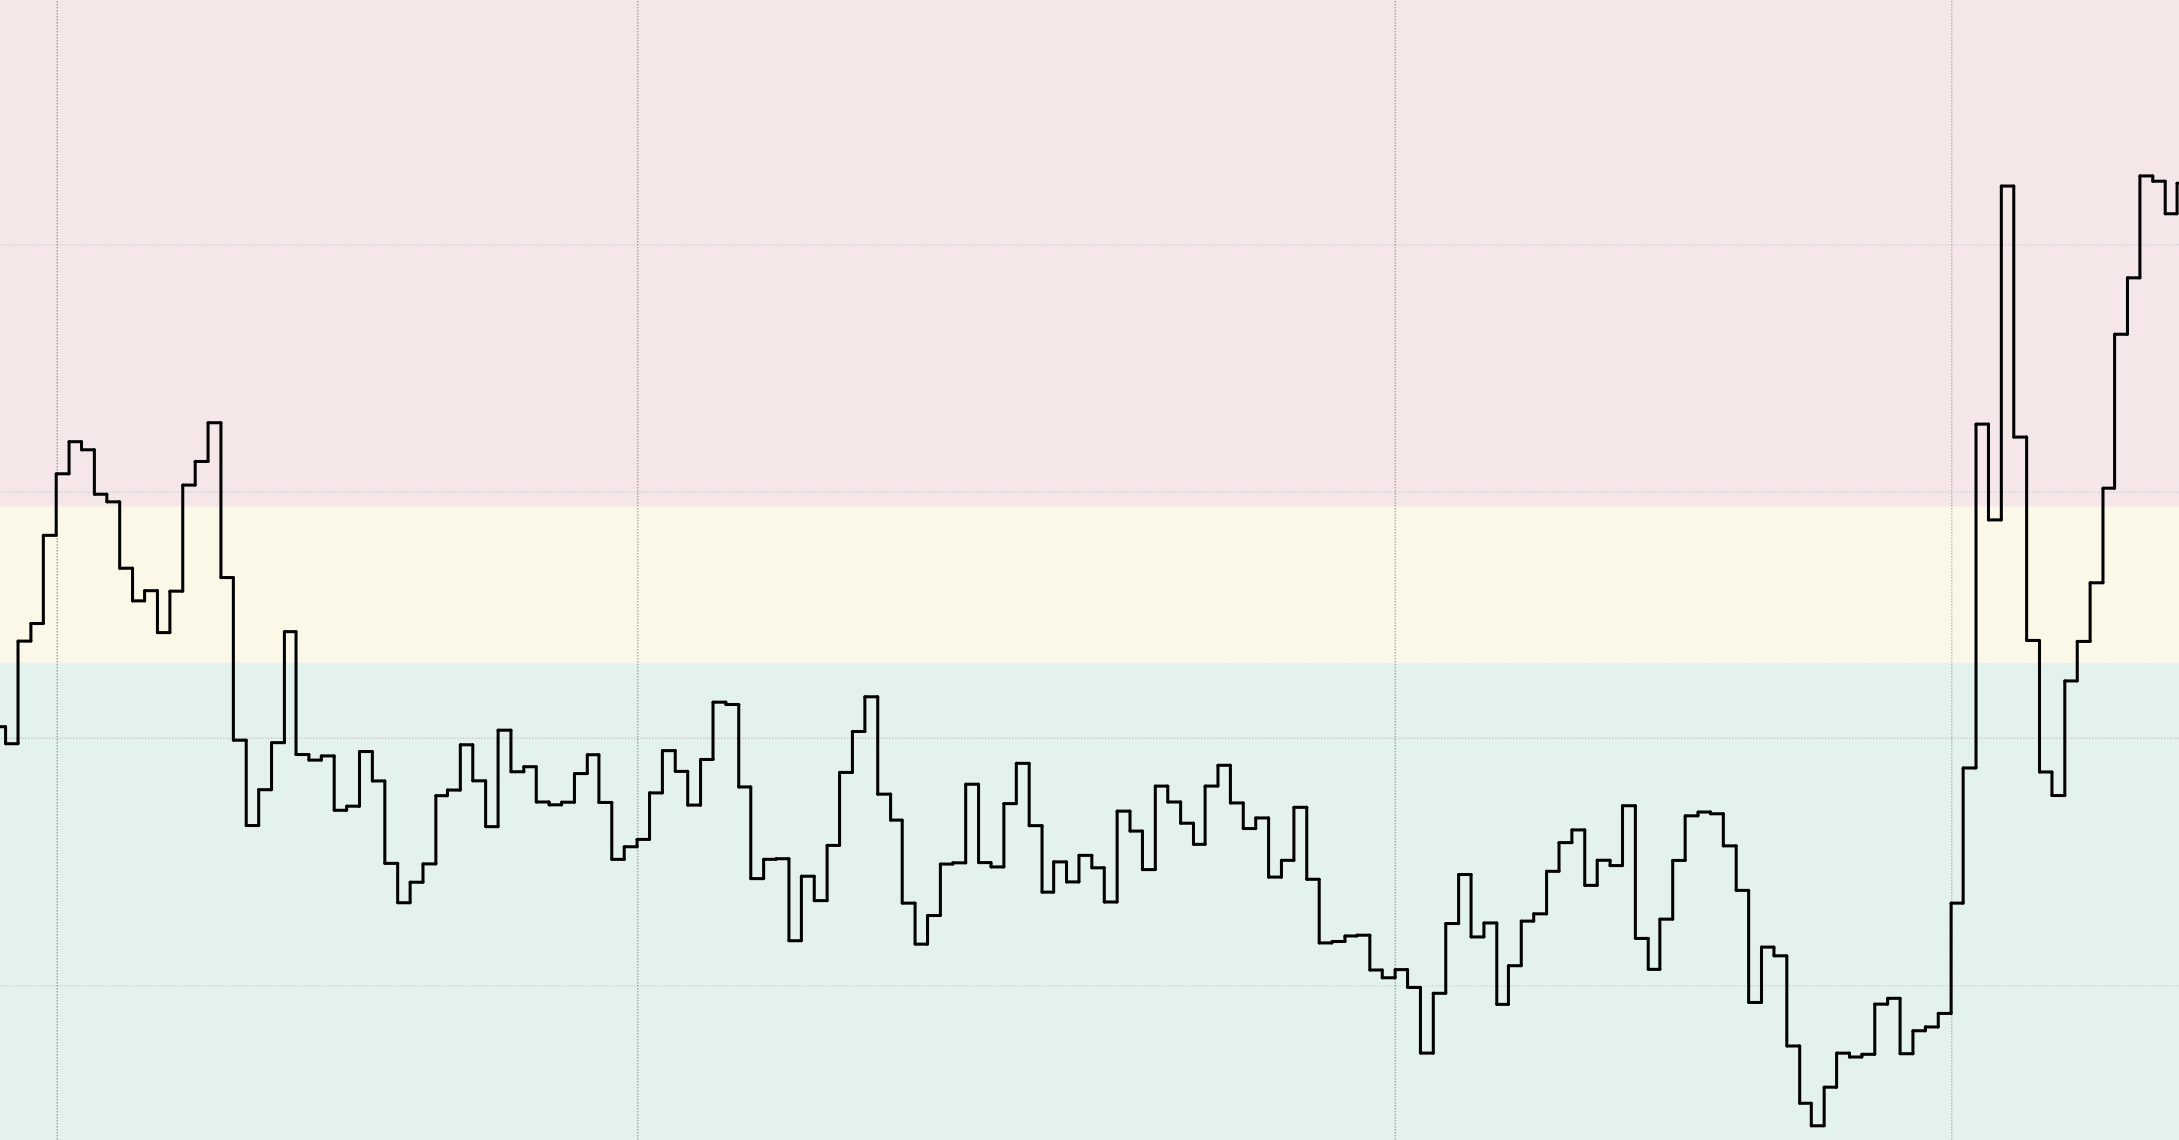
Line Chart
The yellow and red areas in the chart allow a quick interpretation of the data. The yellow area marks the probability that 2/3 of the observations are below the shown limit. The red area is based on the one-sided 90% confidence interval, i.e. the probability that 10% of the index values are above this limit.
Heat Map
In the heat map, the values of individual indicators are shown. It is intended to facilitate the interpretation. interpretation. Indicator values that are likely to be among the 1/3 highest values of the indicator values are colored yellow. Red values are based on the one-sided 90% confidence interval, i.e. the probability that 10% of the indicator values are above this limit.


